Getting Started
How to Access SPSS From you Home Computer
Before we dive headlong into SPSS, I want to give you the Online textbook equivalent of a pre-game pep talk. I realize that statistics is a source of anxiety for many students, as is learning a new software package. The fact that we're making you deal with both in the same semester probably has you wondering whether we're sadistic or just plain evil (FYI—most of us are just plain evil). But—and this is the honest truth—you will eventually find that doing data analysis on a computer is much, much easier than doing it by hand. If you can get past the learning curve, which I admit is rather steep, you'll soon find that you can carry out impressive statistical analyses in half the time it takes to calculate a standard deviation by hand. So take heart! It only gets easier from here.
If you're working from home, the first thing you'll need to do is download and install the Citrix receiver. This video will guide you through the process:
Next, you'll need to download the datasets with which you'll be working. The datasets can be found on Canvas in the "Files" section. There will be three of them: the ADD Health Dataset, the NIS dataset and the World Values Survey. I've put together another video walkthrough:
The third and final step involves logging into the CSBS Virtual Lab, opening SPSS and giving the Citrix receiver permission to access the datasets saved on your local hard drive. Please enjoy yet another video walkthrough:
Alternatively, if you're using the computers on campus, the fact that SPSS is already installed on all the computers in the CSBS computer labs means you get to skip all that nonsense. However, you'll still need to download the datasets. By default, Windows saves them in your "Downloads" folder, which is something you'll need to remember when you actually open them in SPSS. To open SPSS, click on the "Start" button, then go to "All Programs" and scroll down until you see "IBM SPSS Statistics.
When you first open SPSS, you'll likely see some kind of a "Welcome to SPSS" dialog box. You don't need to do anything with this dialog box, though some of the tutorials can be helpful if you ever find yourself stuck. You can click "Cancel" or click on the "x" in the top right corner to make it go away.
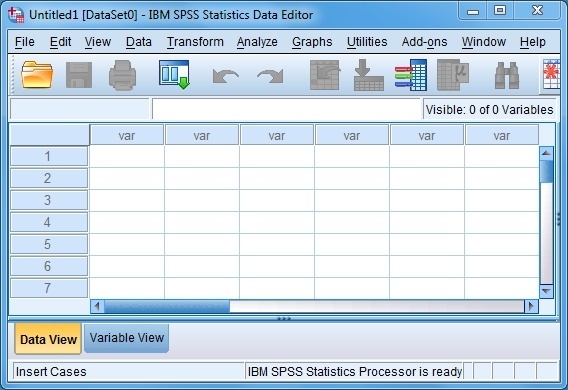
After closing the aforementioned dialog box, you'll see a blank spreadsheet. This spreadsheet is very much like something you would see in Microsoft Excel; the rows represent individual observations (these could be people, states, countries, etc.), and the columns contain the variables you will use in your analysis (or at least they will, once we've loaded some data). Note the tabs at the bottom left corner. Right now the "Data View" tab should be yellow. This is the view that you will use to enter data and examine your observations. Clicking on the "Variable View" tab will take you to a different type of spreadsheet. Note that the headings at the top of each column are different than those in the Data View. The variable view will allow you to code and recode variables, add notes and/or reminders to variables, set levels of measurement and otherwise manage your data. We'll deal with the data and variable views in more detail shortly.
The SPSS Toolbar
For those of you who are new to SPSS, the easiest way to navigate the software is via the drop-down menus. Their functions are summarized in this video and in the paragraphs below:
The File Menu
The primary purpose of the "File" menu, unsurprisingly, is to allow you to work with files in various ways. Much like any Microsoft Office or Adobe program, the "File" tab is where you will go to open an existing file or save your work. The "File" menu also allows you to print your work, open recently used files and close SPSS. There are quite a few other options available through this menu, but you can rest assured that you won't have to deal with most of them.
The Edit Menu
Should you ever need to cut, copy or paste something from one of your datasets, the "Edit" menu will facilitate such actions. This menu also allows you to undo and redo any changes you make to your data (Side note: the fact that SPSS allows you to undo your mistakes is actually one of its major strengths. Not all data analysis programs have such a failsafe). The "Edit" menu also allows you to insert variables, insert cases and search data files, all of which can come in handy while tweaking a dataset to fit your specifications.
The View Menu
The "View" tab allows you to customize the look and feel of your SPSS window. You can change fonts, add or remove grid lines and manage toolbars.
The Data Menu
The "Data" menu's applications are virtually endless, but using it requires some level of training and expertise. Most of the statistical black magic found in this menu is beyond the scope of this course, but those of you who continue on to graduate school will get to know these functions intimately.
The Transform Menu
There will come a time this semester when you will need to convert a variable from one form to another (i.e., convert an interval/ratio-level variable to an ordinal-level variable). The "Transform" menu allows you to do just that. You can choose to either "Recode into Same Variable" which will effectively replace the old interval/ratio-level variable with the brand new ordinal-level variable, or "Recode into Different Variable," which will create the new variable without affecting the old one.
The Analyze Menu
The "Analyze" menu is the SPSS equivalent of a Swiss Army knife. Or a roll of duct tape. Or maybe a can of WD-40. In other words, it's perfect for the sort of mean-and-potatoes data analysis that you'll be doing this semester. The "Analyze" tab is where you'll go to do everything from calculating means and standard deviations to running T-tests and regression models. Virtually all of the walkthroughs in this manual begin here. Also, if you're ever unsure about how to perform a certain type of analysis, this tab is a logical place to start.
The Direct Marketing Menu
The "Direct Marketing" tab is where you would go should you ever have the desire to customize SPSS for use in very specific analytical contexts (i.e., creating actuarial tables). You can go ahead and ignore the "Direct Marketing" tab.
The Graphs Menu
Data visualization is an important part of statistical analysis, and it all begins with the "Graphs" menu. You can either use the "Chart Builder" to create a graph from scratch or use the "Legacy Dialogs" sub-menu to choose from a set of pre-existing options. The former allows you more control over the final product, but the latter is quicker and easier.
The Utilities Menu
The "Utilities" menu contains information about variables and files. It also allows you to define and analyze subsets of variables. We won't be doing much with the "Utilities" menu.
The Add-Ons Menu
Should you ever need information on SPSS consulting (which you almost certainly will not), this is where you would go to find it.
The Window Menu
As is the case with virtually any Windows-based program, the "Window" menu allows the user to switch between windows and minimize the data editor or output window.